
1
/
of
1
FOREX ROBOT DOWNLOAD
CHART INTELLIGENCE SYSTEM 1
CHART INTELLIGENCE SYSTEM 1
Regular price
$99.00 USD
Regular price
$1,999.00 USD
Sale price
$99.00 USD
Unit price
/
per
Couldn't load pickup availability
Original website: http://www.chartintelligence.com/system1/
\n
\nOriginal price: $1999.00
\n
\nYour price: $99.00
\n
\nContent: Latest version with update, fully compatible with the latest version!
\n
\n
\n
\n
\n
\n
\n
\n
\n
\n
\n
\n
\n
\n
\n
\n
\n
\n
\n
\nSystem No. 1
\n
\n
\nLow risk high reward MTT4 swing trading system that uses custom 4 color brick bars and advanced trend meter to make trading more simple and professional. Perfect for intraday traders.
\n
\n
\n
\n
\n
\n
\n
\n
\n
\n
\n
\n
\n
\n
\n
\n
\n?
\n
\n
\nMTT4 Compatible
\nInstall with one click and the system will smoothly integrate into your platform. \n \n
\n
\n
\n
\n
\n
\n*
\n
\n
\nUp or Down?
\nWith our advanced trend filters and custom four color brick bars the trend direction is never a question. \n \n
\n
\n
\n
\n
\n
\n?
\n
\n
\nLow Risk, High Reward
\nThe custom money management rules will boost your performance and protect the reached profit at the same time. \n \n
\n
\n
\n
\n
\n
\n
\n
\n
\n
\n
\n
\n
\n
\nThe Challenge
\nWe were asked to create a professional trend-follower style MTT4 compatible trading system that is perfect for everyday use and has a very good risk/reward ratio. It was also important to create a unique base chart (not candlesticks, heiken-ashi or bar charts), and the system needed to have exact entry and exit points. \n \n
\n
\n
\n
\n
\n
\nThe Solution
\nWe created System No.1. to fit the needs of trend traders. We coded a two color multi-component ribbon to show the trend direction, developed a 100% custom four color brick bar base chart for easy and exact entries and exits and even added a trend meter for trend confirmation, and an instrument name watermark. \n \n
\n
\n
\n
\n
\n
\n
\n
\n
\n
\n
\n
\n
\n
\nThe Results Are Amazing
\nThe power of system No. 1 is in the smooth clean look of the charts. It is extremely easy to read the custom four color brick bars and with the multi-component ribbon it’s never been easier to determine the trend direction. \n \n-
\n
- Easy to Install81% \n
- Easy to Use84% \n
- Performance89% \n
- Customer Satisfaction97% \n
\n
\n
\n
\n
\n
\n
\n
\n
\n
\n
\n
\n
\n
\n
\n
\n
\nLike the stunning new look of our charts?
\n
\n
\n
\n
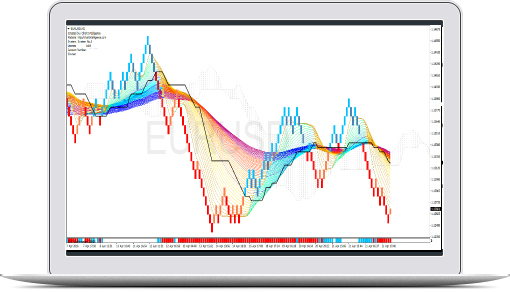
\nSystem No1 was completely redesigned in 2017. We updated the charts with a couple of luxury confirmation tools and changed the colour of the Trend Rainbow to make it visually more attractive and to help traders to visualise the movement of a currency pair. We also removed the Trend Meter as it wasn’t a significant part of the system while it needed too much computer resources to run. The usage of the additional confirmation indicators is optional, however in our experience these tools can make your trading safer and more precise.
\n
\nThe new Trend Rainbow is an unique and luxury trend indicator. The new Trend Rainbow indicator is excellent in identifying a trend. Dark strips represent the decisions of long-term investors, lighter strips represent the decision of medium-term traders, and light strips represent short term traders. Cool colors mean bullish trend, warm colors mean bearish trend. With the Trend Rainbow, you can see the structure of the whole market in one chart. It is recommended to always trade in the direction of the Rainbow trend.
\n
\nThe Black Line that runs approximately in the middle of the TrendRainbow is a separated component of a complex Japanese indicator. You can use it as a secondary trend confirmation tool, as if the bricks are below the Black Line, short positions have more chance, and if the bricks are above the Black Line, the long positions are more possible. You can also use this line as an ultimate stop-loss level.
\n
\nThe Cloud that appears behind the TrendRainbow is another excellent trend confirmation tool: if the bricks are below the Cloud, the trend is bearish, if the bricks are above the Cloud the trend is bullish, while if the bricks form in the body of the Cloud the trend is neutral.
\n
\nFinally, the new CHI_Confirmation indicator that runs at the bottom of your chart adds a third layer of trend confirmation to your toolbox. If during a bearish trend red colour stripes appear, it confirms the validity of a short position, while during a bullish trend the same red stripe would indicate a potential exit point (or at least trend-weakening), and vice-versa for blue colour stripes.
\n
\nPlease keep in mind that all the trading rules of System 1 are the same as you can find in the original user manual. These tools were added to refine the system and provide experienced traders with even more sophisticated confirmation tools.
\n
\n
\nShare